
Managing Agents are under increasing pressure to access clear, consistent business intelligence across the premium processing lifecycle, yet many still lack a single, consolidated view. As scrutiny on performance and process continues to grow, there is a clear need for timely, reliable insight that enables leaders to act proactively and with confidence.
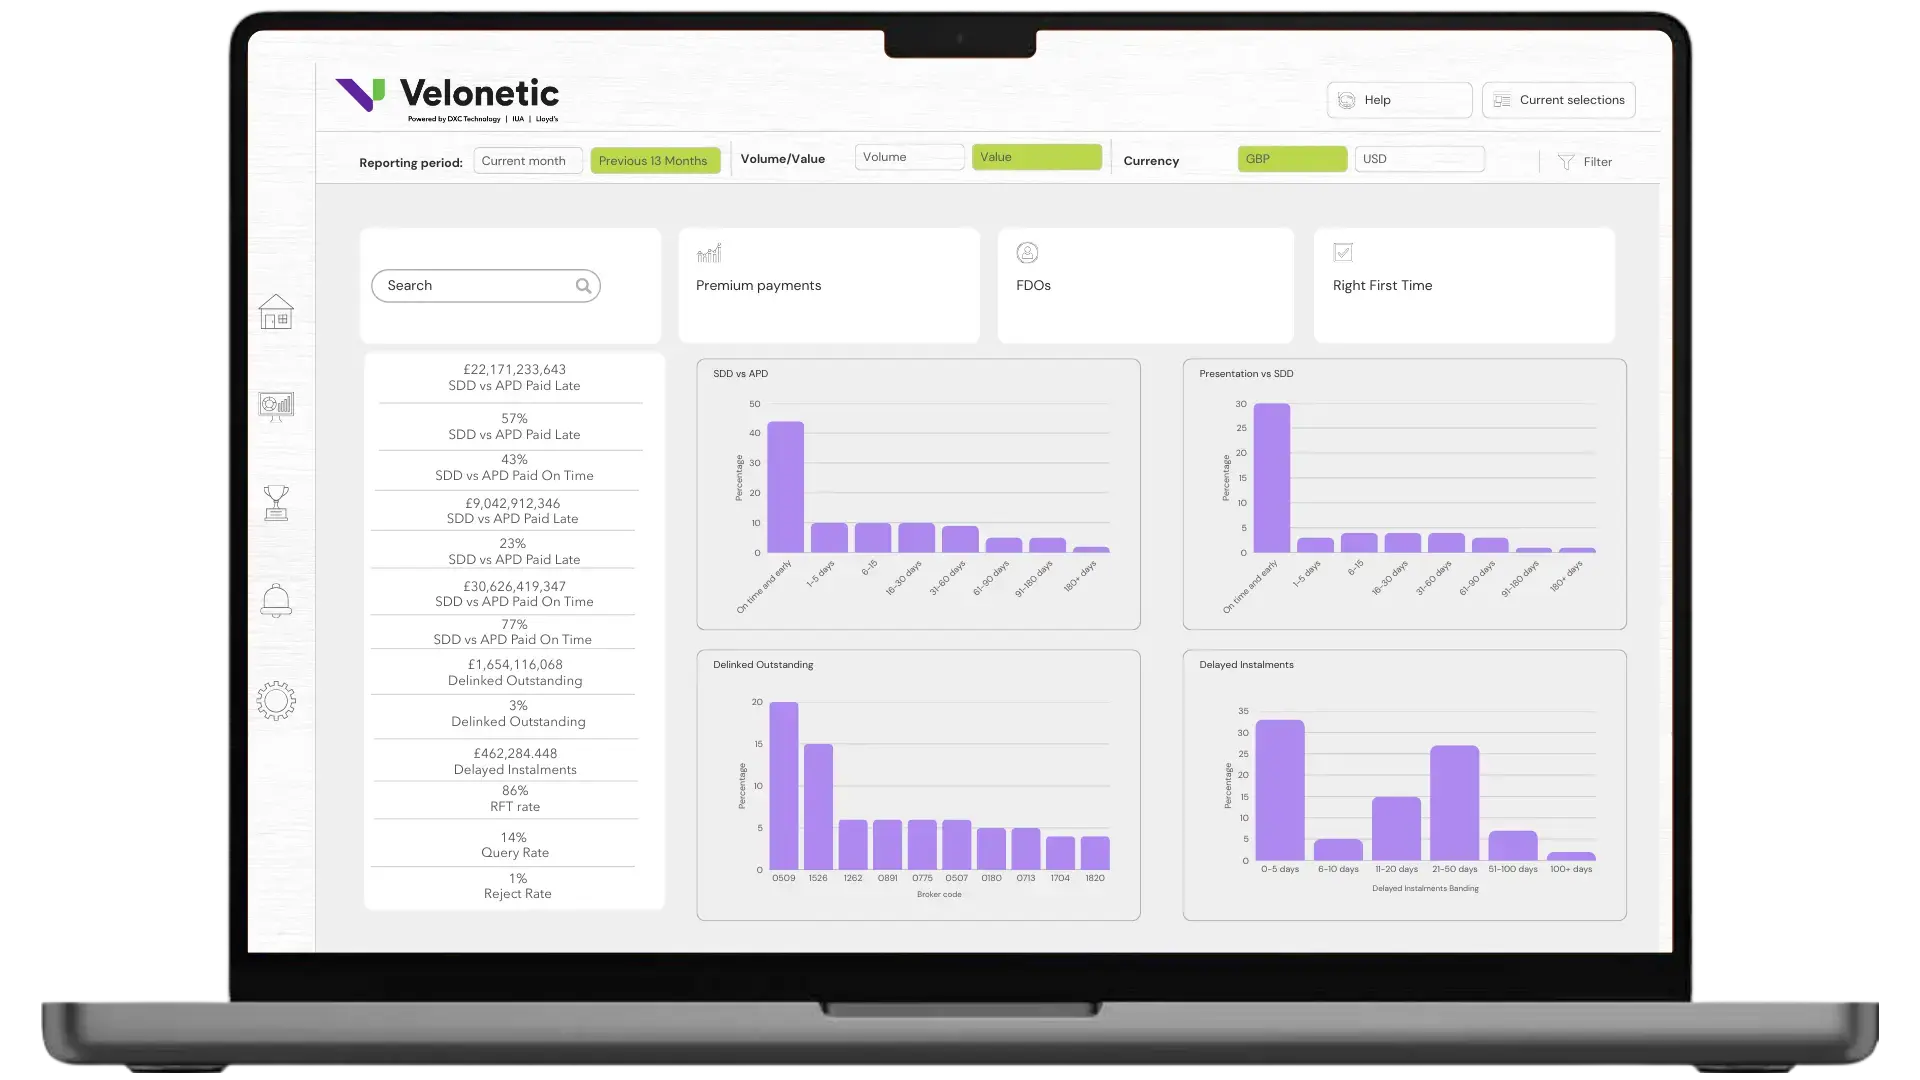
The LMA Broker Performance Dashboard has been developed to address this gap, bringing together fragmented data into a single, consolidated view of performance alongside market benchmarks. In doing so, it enables Managing Agents to make more informed, confident decisions.
To explore how this shift is playing out in practice, we spoke to Anne and John, who share their perspectives on the evolving role of data insights and the impact of the Broker Performance Dashboard.
Why is visibility of premium processing performance becoming a strategic priority now?
Across the market, there has been a lack of a consistent, market-wide view, making it difficult to understand where variation exists, what is driving it, and where action is most needed.
This is why greater visibility of premium payment and submission quality has become a strategic priority. It helps organisations move beyond perception and bring clarity, consistency and evidence into conversations that affect operational performance, broker relationships and wider business outcomes.
What was missing in how Managing Agents traditionally understood broker performance?
Historically, Managing Agents could only view premium submission activity through their own organisational lens. They might identify trends within their own data, but they had limited ability to understand how that compared with the wider market. That made it difficult to understand where friction occurred during the premium submission journey.
There has also been limited visibility of premium submissions as they progress through the market process and where delays occur. As a result, assumptions have often been made about where bottlenecks sit. By bringing the data together, it becomes easier to understand how different factors — including the quality and complexity of initial submissions can influence downstream processing and overall outcomes.
What types of leadership decisions or conversations do better premium processing and broker performance insights enable?
A clearer view of premium submissions supports more informed conversations across underwriting, operations, finance and leadership teams. It allows Managing Agents to compare their own experience against market benchmarks, identify areas of variation, and make decisions based on evidence rather than instinct.
That can shape decisions about how broker relationships are managed, where intervention is needed, and how organisations respond to recurring quality issues. At a leadership level, it also creates greater clarity around premium timelines, cash flow, cost efficiency, workload, and overall business planning.
How does the Broker Dashboard address this challenge differently from traditional reporting?
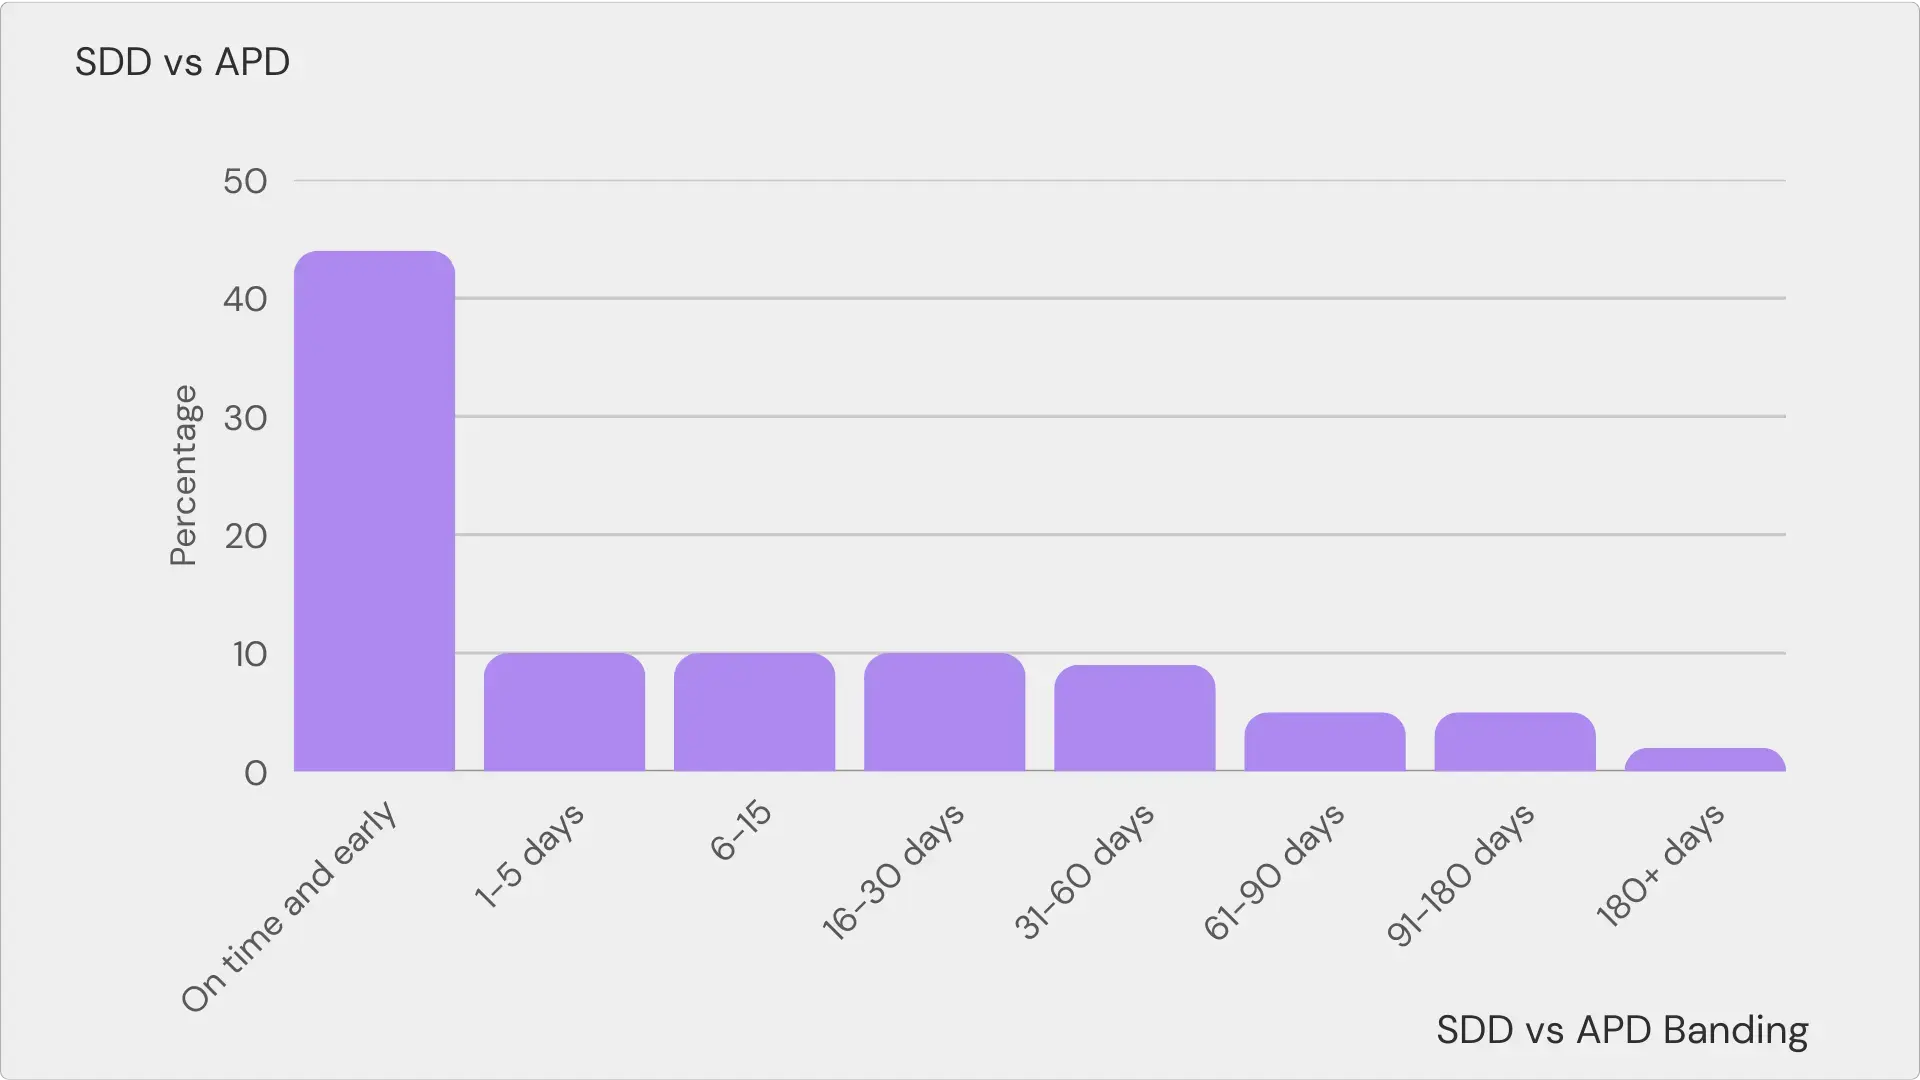
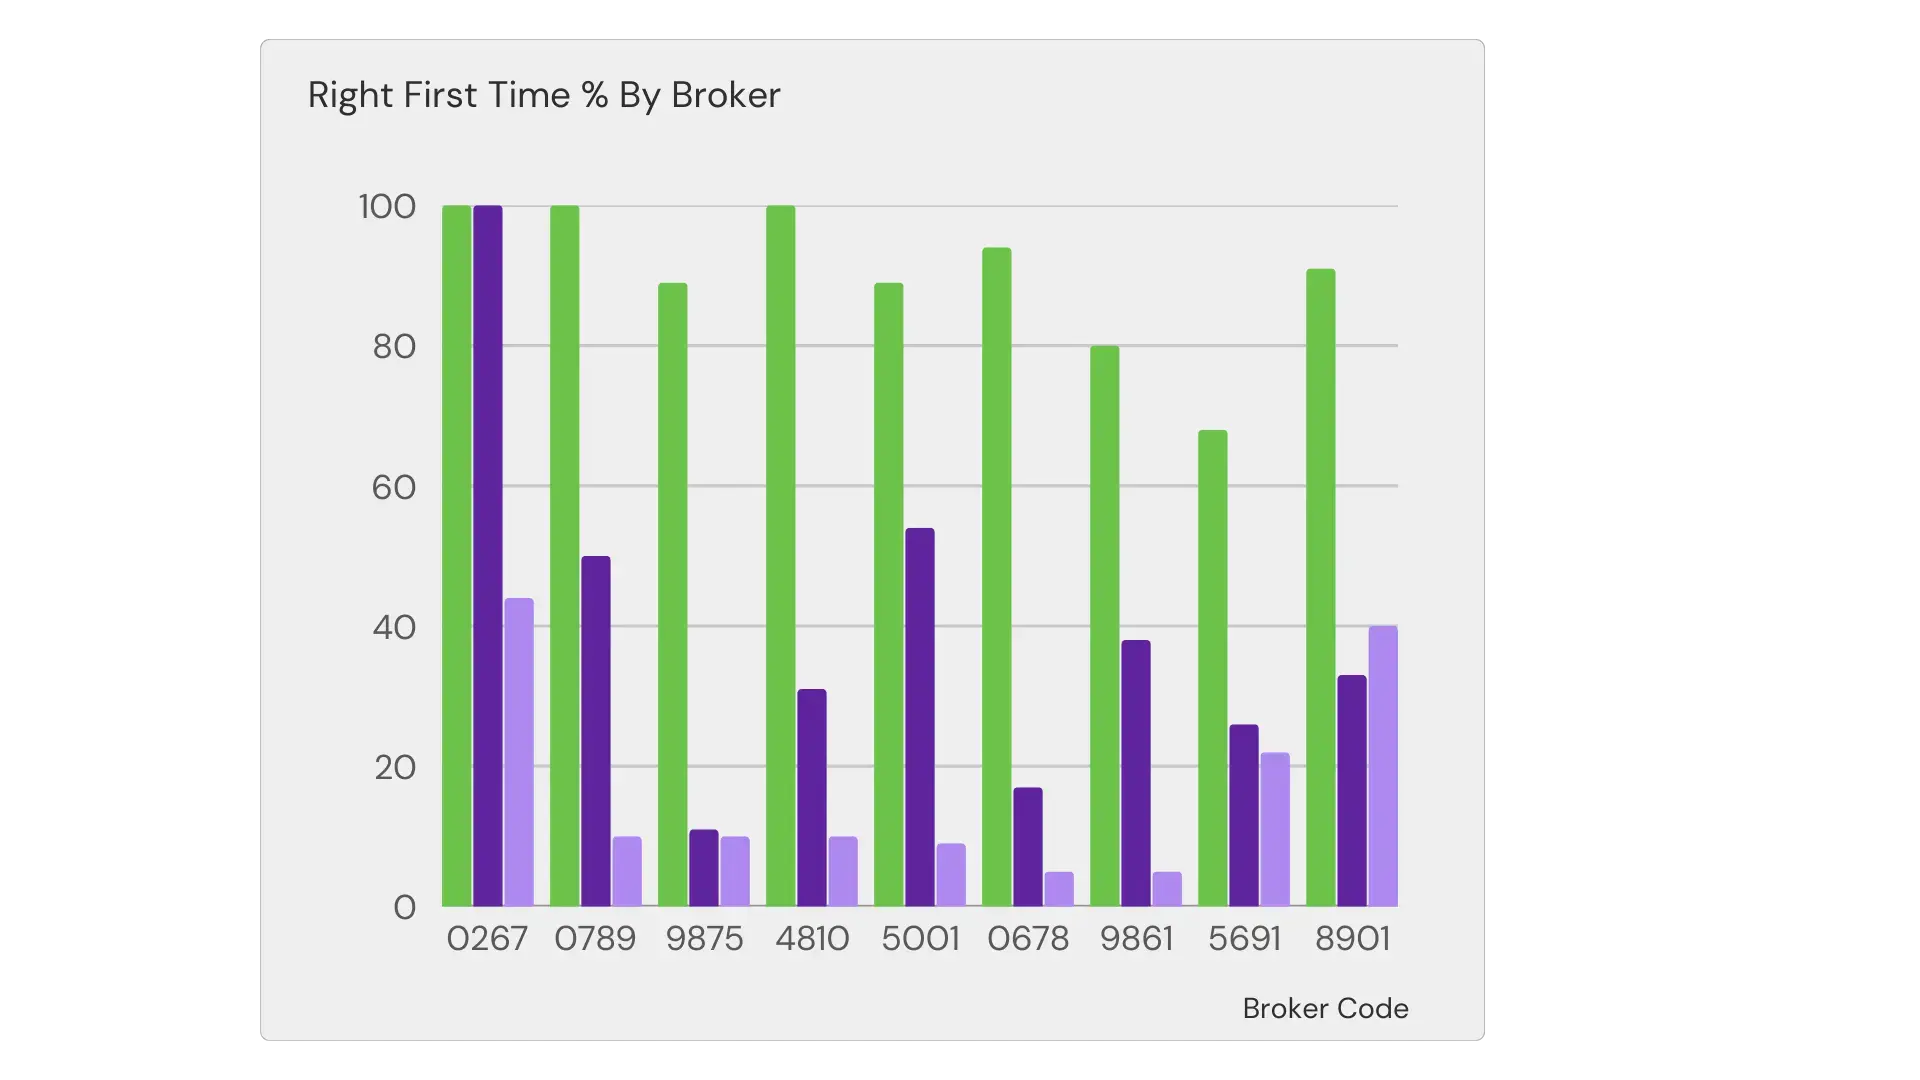
The Broker Dashboard brings key KPIs and performance measures into a single, consolidated view, replacing fragmented reporting with a clear, actionable picture of performance. Critically, it introduces a market benchmark, giving Managing Agents context for their performance and enabling more confident, fact-based decision-making.
Why is it important to make a free Tier 1 dashboard available to all Managing Agents?
Making Tier 1 freely available provides a shared market view of broker performance. It provides Managing Agents with a baseline view of performance and helps reinforce or challenge long-held perceptions with factual data.
It also reflects a clear intent to put useful insight into the hands of the market and encourage broader engagement with the data. When everyone has access to the same baseline view, it becomes easier to have more informed conversations and identify common themes that may require collective attention.
What signals tell an organisation that it’s ready to go beyond the initial view of broker performance?
With access to organisation-specific insight, Managing Agents can explore why their results differ from the market, pinpoint root causes, and have more targeted conversations with brokers. In short, the managing Agent can focus improvement efforts where they have the greatest impact.
Why was it important that this service was developed with the market, not just for it?
One of the strongest aspects of the service is that it has been developed in collaboration with the LMA and a panel of market participants; the dashboard reflects a shared market effort to improve visibility and performance. This approach not only ensures relevance but also creates a foundation for collective progress, where insights can be used to address common challenges across the market.
How should Managing Agents think about the Broker Dashboard evolving?
The Broker Dashboard should be seen as an evolving capability rather than a static service. As Managing Agents use it, uncover insights and identify new requirements, the service should continue to adapt.
That means ongoing dialogue, regular feedback loops, and a roadmap shaped by real user needs. Over time, that could include additional filters, deeper functionality, or relevant new datasets that help keep the dashboard practical, current, and valuable to the market.
What would you say to a leader who knows broker performance matters but isn’t sure where to start?
For leaders who want greater visibility of premium submission quality but are unsure where to begin, the best starting point is the market view. It provides immediate context around key measures, helps organisations understand the benchmark, and highlights where closer attention may be needed.
From there, the next step is to explore organisation-specific performance in more detail, using the data to understand what is driving results and where improvements can be made. Combined with demos, trials and market collaboration, this creates a practical route from visibility to action.
In one sentence, how does this help leaders make better decisions about broker performance?
The Broker Dashboard gives Managing Agents a practical way to move from perception to evidence, benchmark market performance, identify operational friction and focus improvement efforts where they can have the greatest impact.
About the contributors
Anne Pearsall and John Murray are part of Velonetic’s product and data leadership teams, working closely with the market to improve visibility and performance across premium processing.
Want to learn more?
Explore the Broker Dashboard and discover how market-wide insight can support more informed decision-making.