
Get the broker management information dashboard co‑created with the Lloyd’s Market Association
Broker payment behaviour and submission quality directly affect cash flow and operational workload. Yet the market has lacked a single, consistent view to show how brokers are interacting with premium processing. With data split across separate reports, it is hard to spot issues early or understand whether challenges are isolated or market wide.
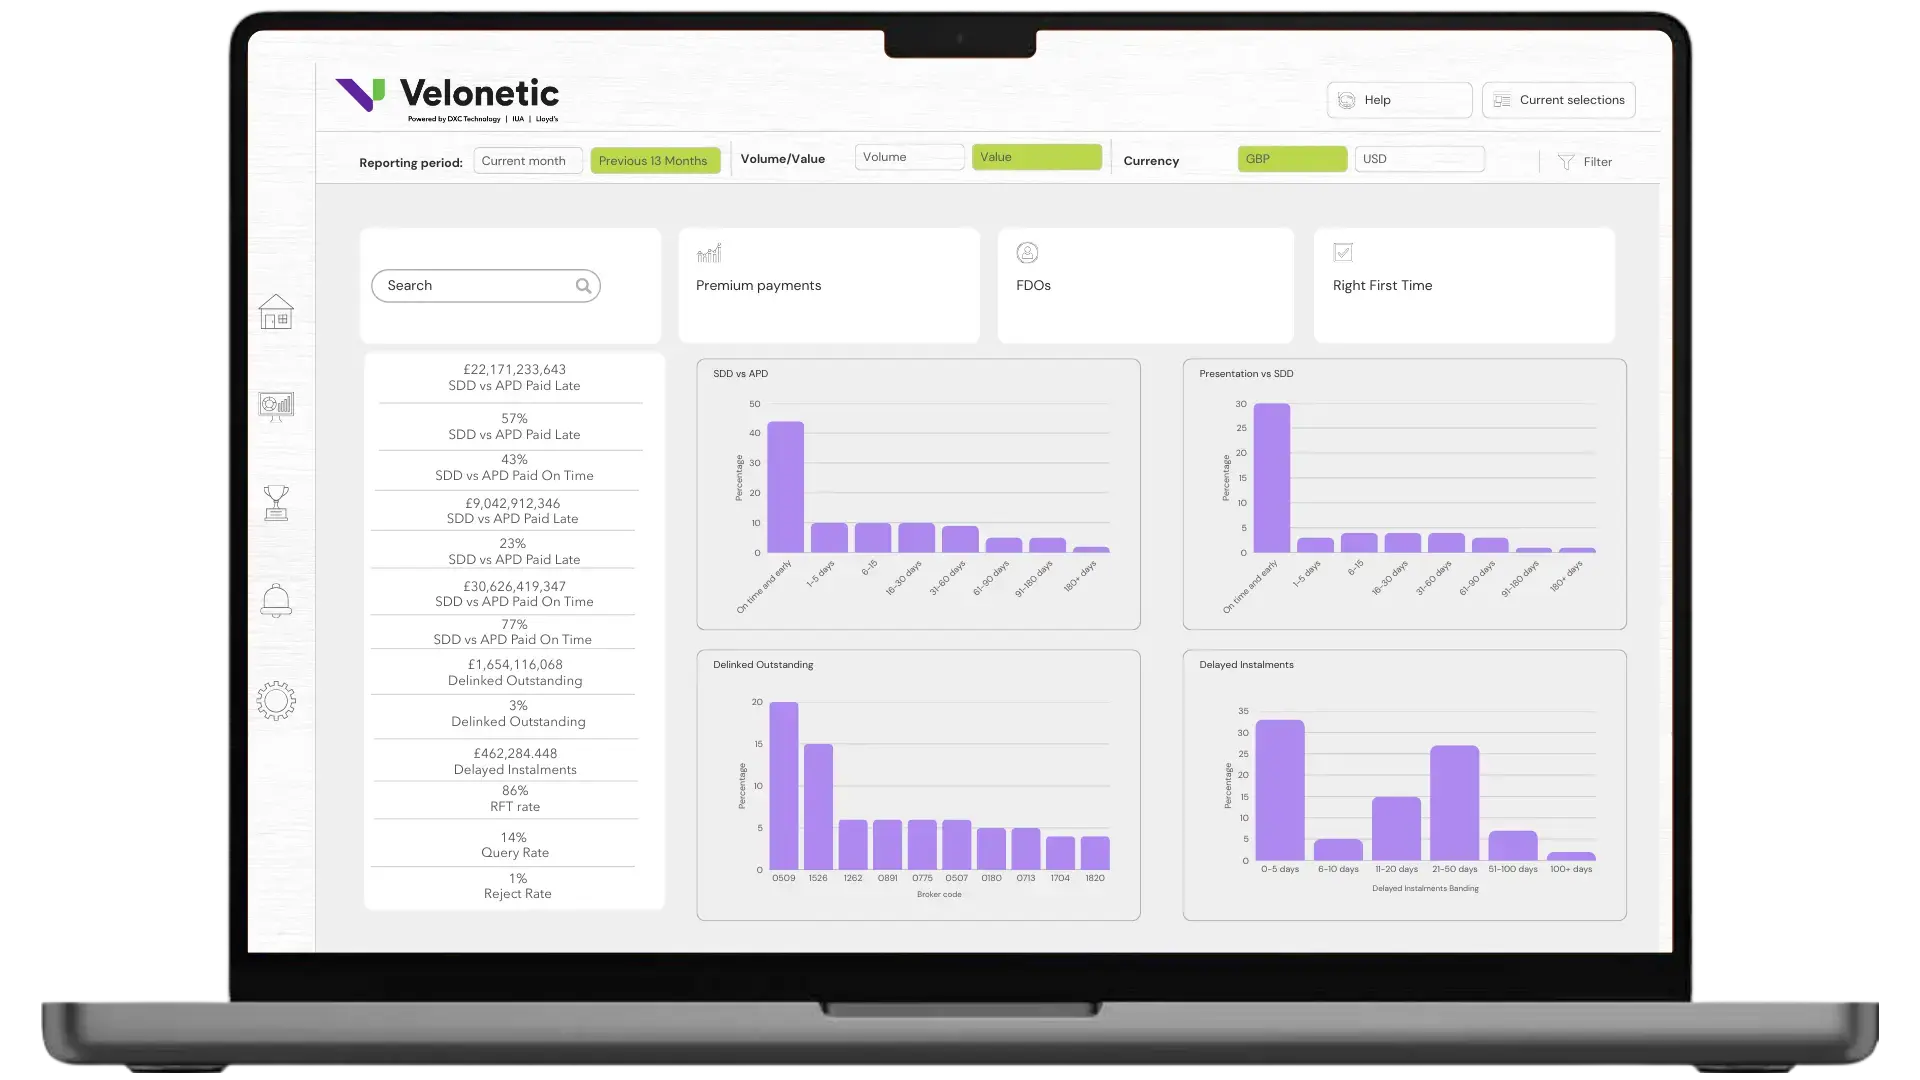
The Broker MI Dashboard Service is designed to change that. Built on the QlikView platform, it transforms fragmented market data into actionable insights, helping you shift from guessing to knowing how brokers you work with are performing.
Performance management simplified
Velonetic is the unique source of truth for the London Market. By combining our data with the Lloyd’s Market Association's strategic oversight, we developed a Qlikview dashboard to help you scale efficiency.
See the big picture
Benchmark your performance against 13 months of market-wide broker data.
Fix the root cause
Drill down into transaction-level detail to identify exactly where rework is triggered.
Speed up the flow
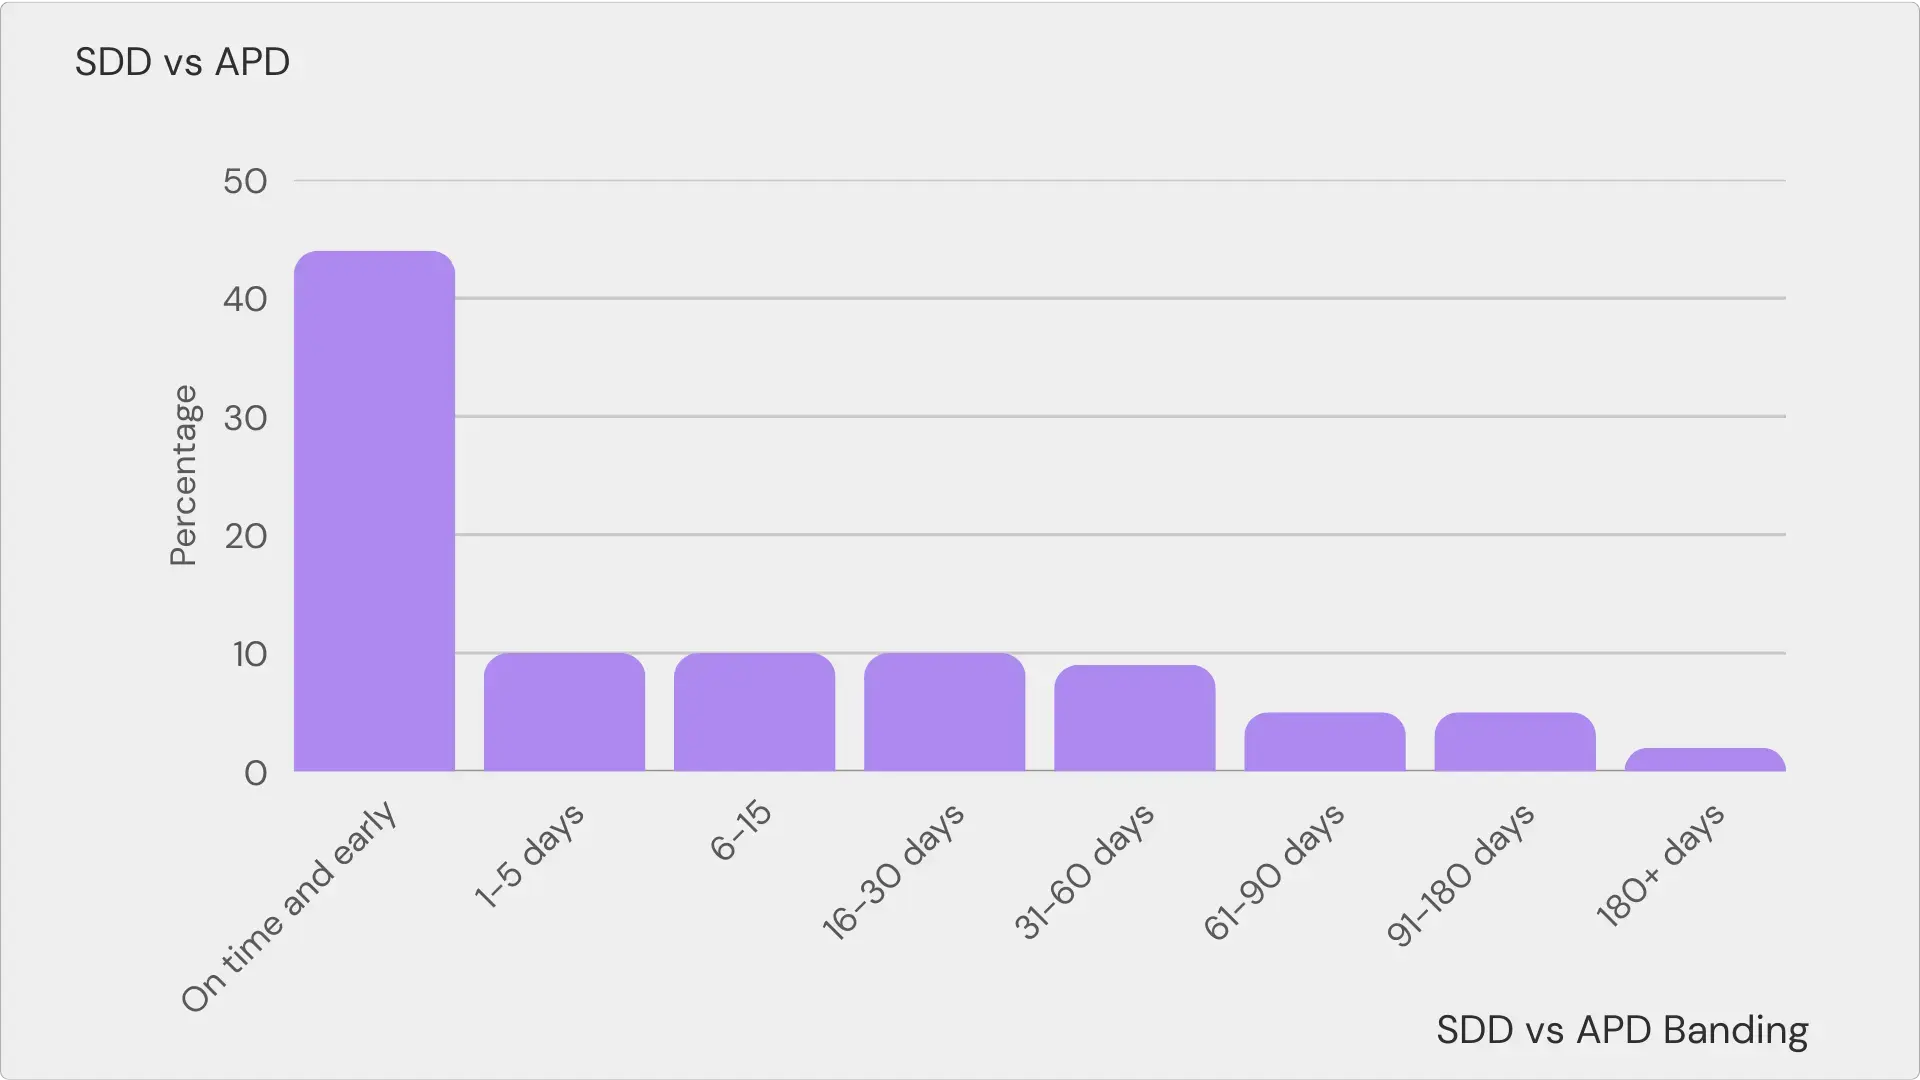
Monitor technical accounting timeliness to get premium to underwriters faster.
How it helps Managing Agents
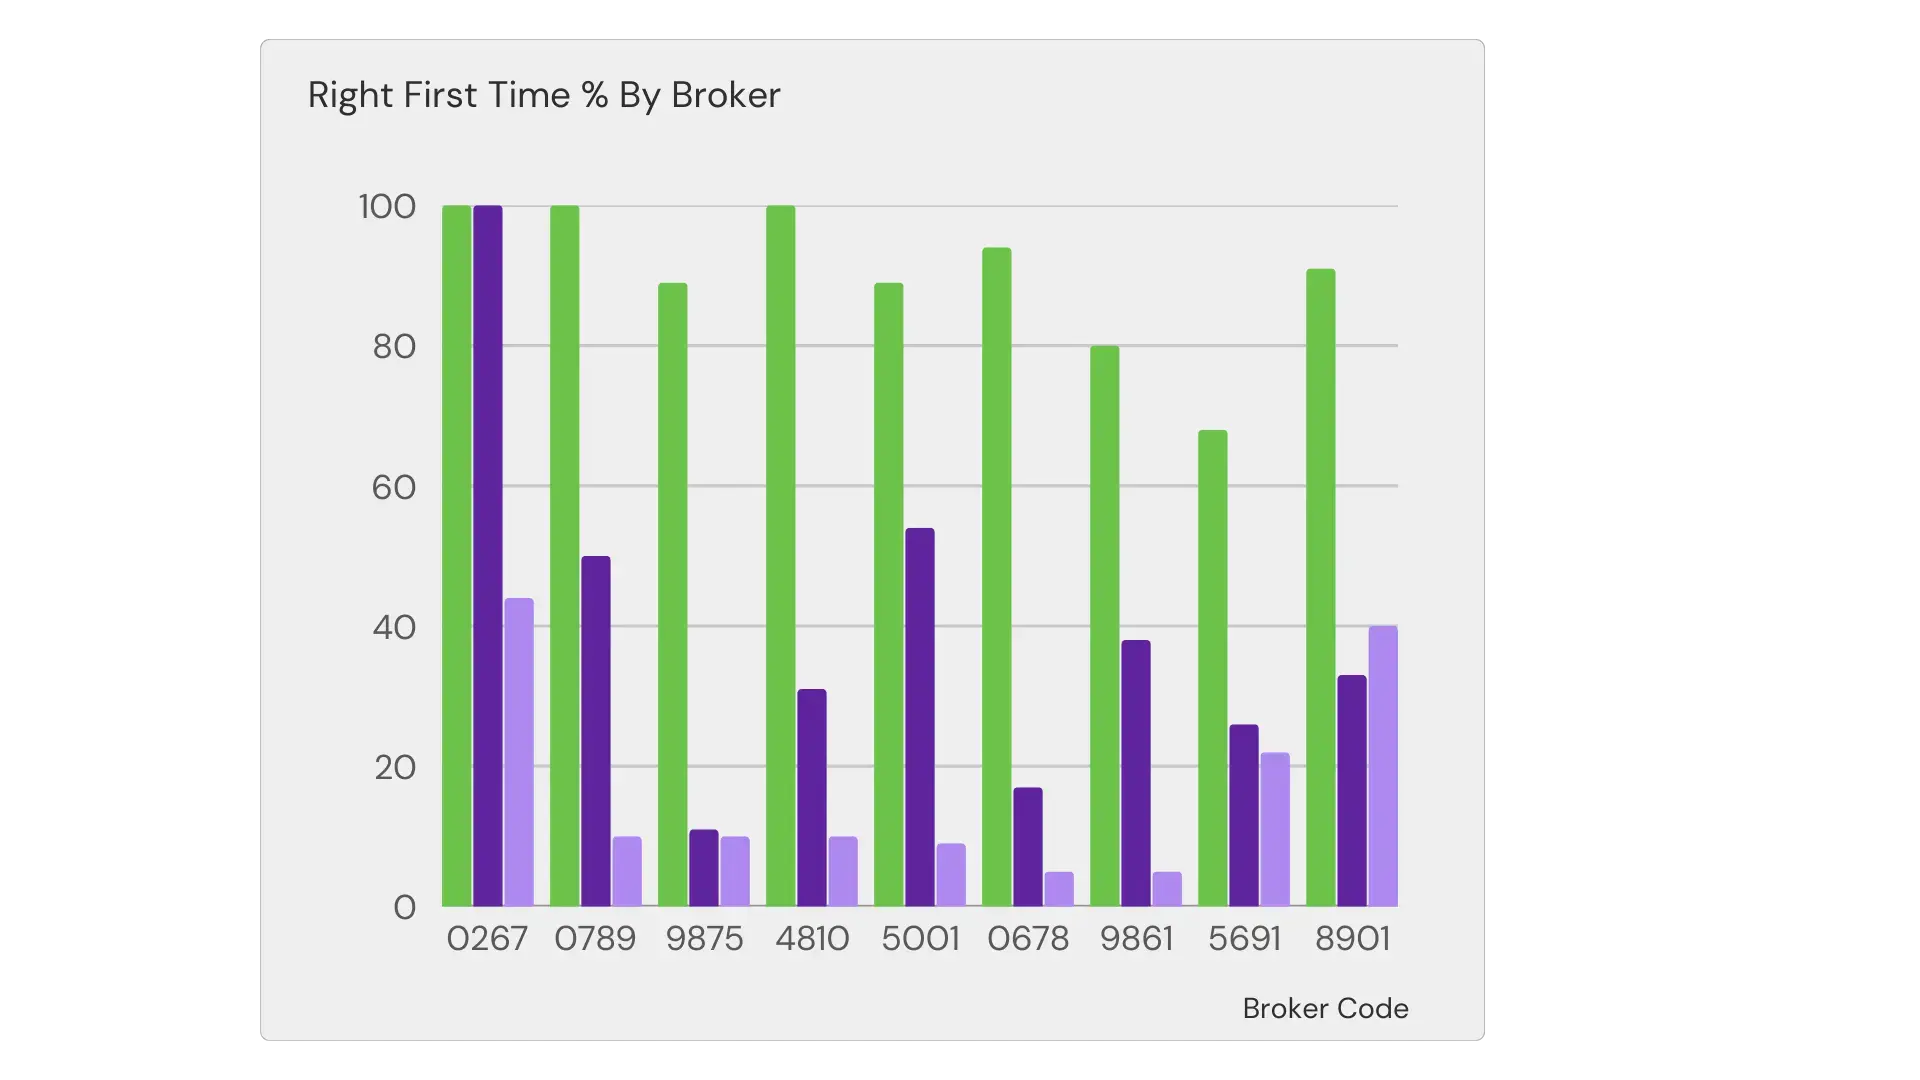
- Benchmark against the market: See how behaviour compares at a market‑wide level.
- Understand where friction arises: Identify where rework, delays or late payments are occurring.
- Support operational improvements: Evidence‑led insight for credit control, operations and stakeholder conversations.
- Prepare for future digitisation: A baseline view to help assess improvements when digital processing evolves.
Choose the view that fits your business
Whether you need high-level market trends or deep-dive operational data, we have a solution ready for you.
Tier 1: Free Market Baseline dashboard
A neutral, aggregated view of market behaviour, refreshed monthly with 13 months of trend data. Designed for benchmarking, operational understanding and committee insight.
Tier 2: Business deep-dive
A deeper view of your own performance with up to three years of history, daily refresh and transaction level detail. Includes comparison against the market.
View metrics that matter
Everything you need to drive performance is organised into four key pillars.
- Quality: View broker submission accuracy and eliminate costly rework.
- Timeliness: Track technical accounting and premium payment promptness.
- Visibility: Get a real-time pulse on work in progress within Velonetic.
- History: Analyse trended progression to prove your operational growth.
Get started in 3 steps
Step 1
Complete the register your interest form and Data Services will provide the formal registration form to complete
Step 2
Receive your access instructions from our Data Services team. A demo can be provided if required.
Step 3
Log in to QlikView and start leading with confidence.
Avoid operational stagnation
Continuing to rely on outdated reporting methods is a risk to your efficiency. Without access to these shared insights, your team remains blind to the specific submission errors that slow down your technical accounting and impact your bottom line.
Access is typically provisioned within ten working days of completed registration.